Bricks
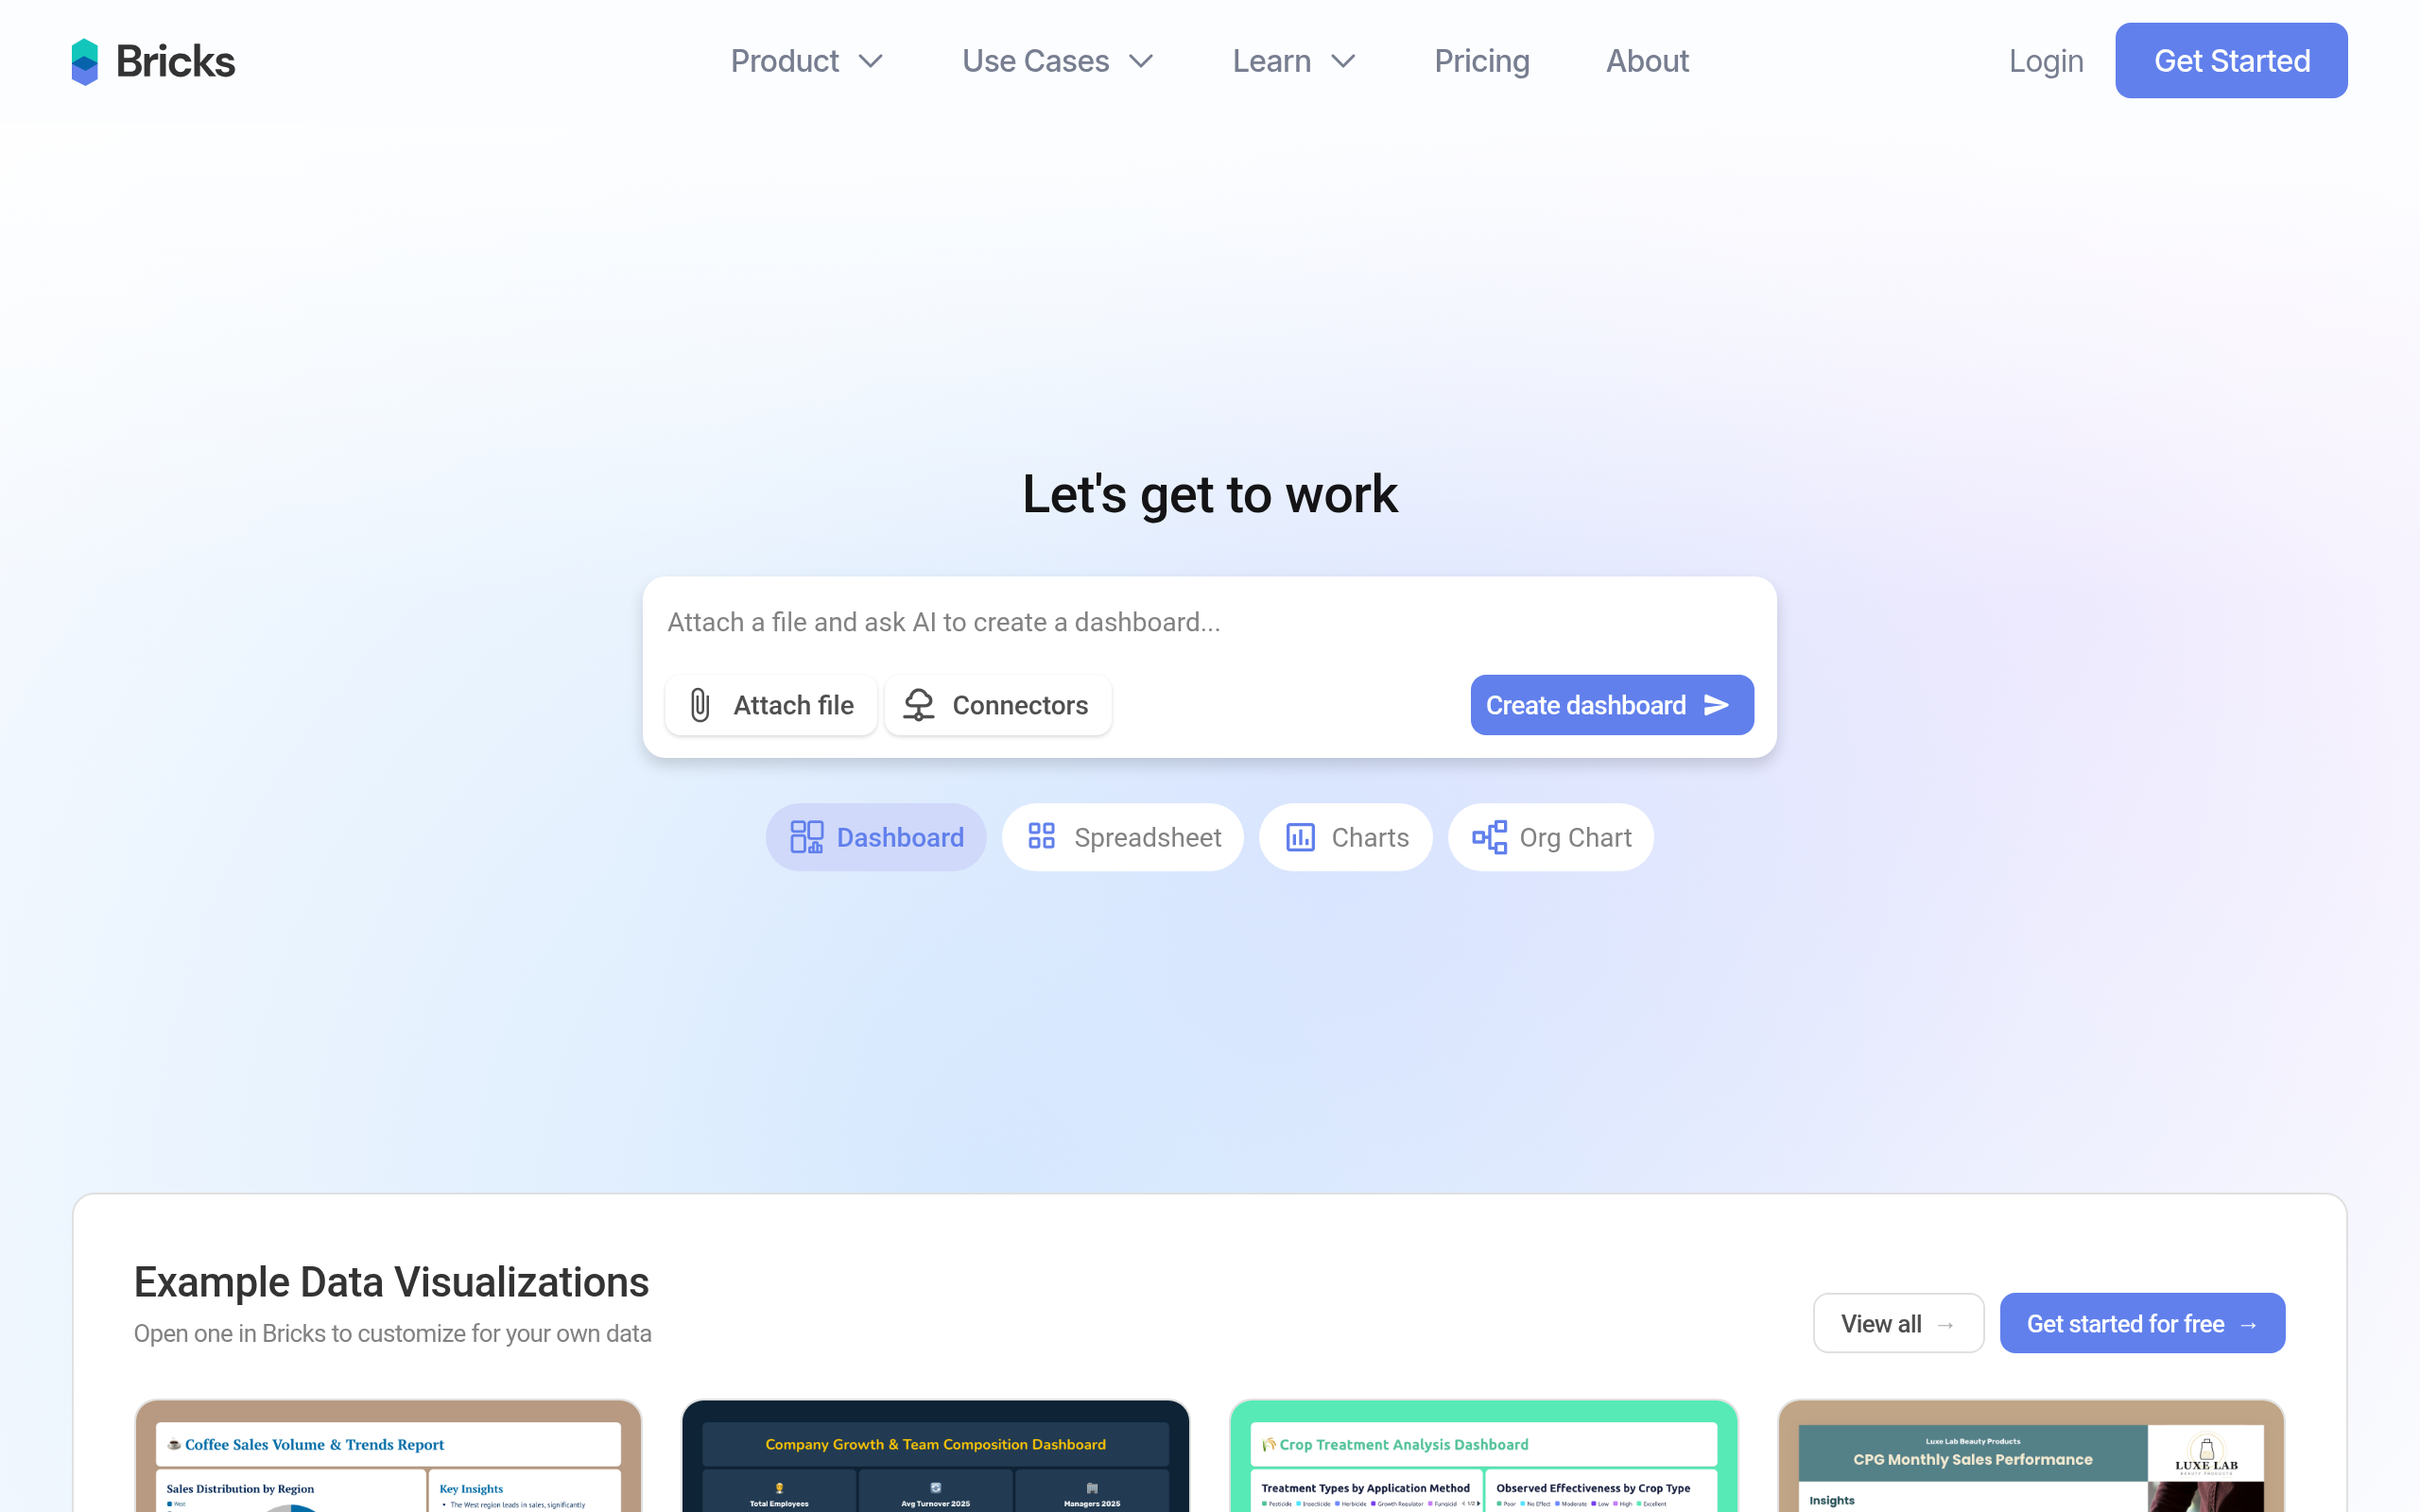
71Comparee ScoreAI-powered tool to turn CSV and Excel data into beautiful dashboards and reports in seconds.
Comparee rates Bricks 71/100 in Data Analysis & BI — based on catalog data as of June 2026. Methodology.
About Bricks
Pros & cons
✓ Pros
- ✓Significantly faster than manual Excel dashboard creation
- ✓Easier to use than complex BI tools like Tableau and Power BI
- ✓Superior visual design and storytelling compared to alternatives
- ✓No design or technical skills required
- ✓Full control over customization with AI assistance
- ✓Supports multiple data sources and formats
- ✓Professional output suitable for client and executive presentations
✗ Cons
No significant drawbacks documented yet.
Bricks pricing
Frequently asked questions
What is Bricks?
Bricks is a Data Analysis & BI tool: AI-powered tool to turn CSV and Excel data into beautiful dashboards and reports in seconds.
Is Bricks free?
Bricks offers a free option.
What are the best Bricks alternatives?
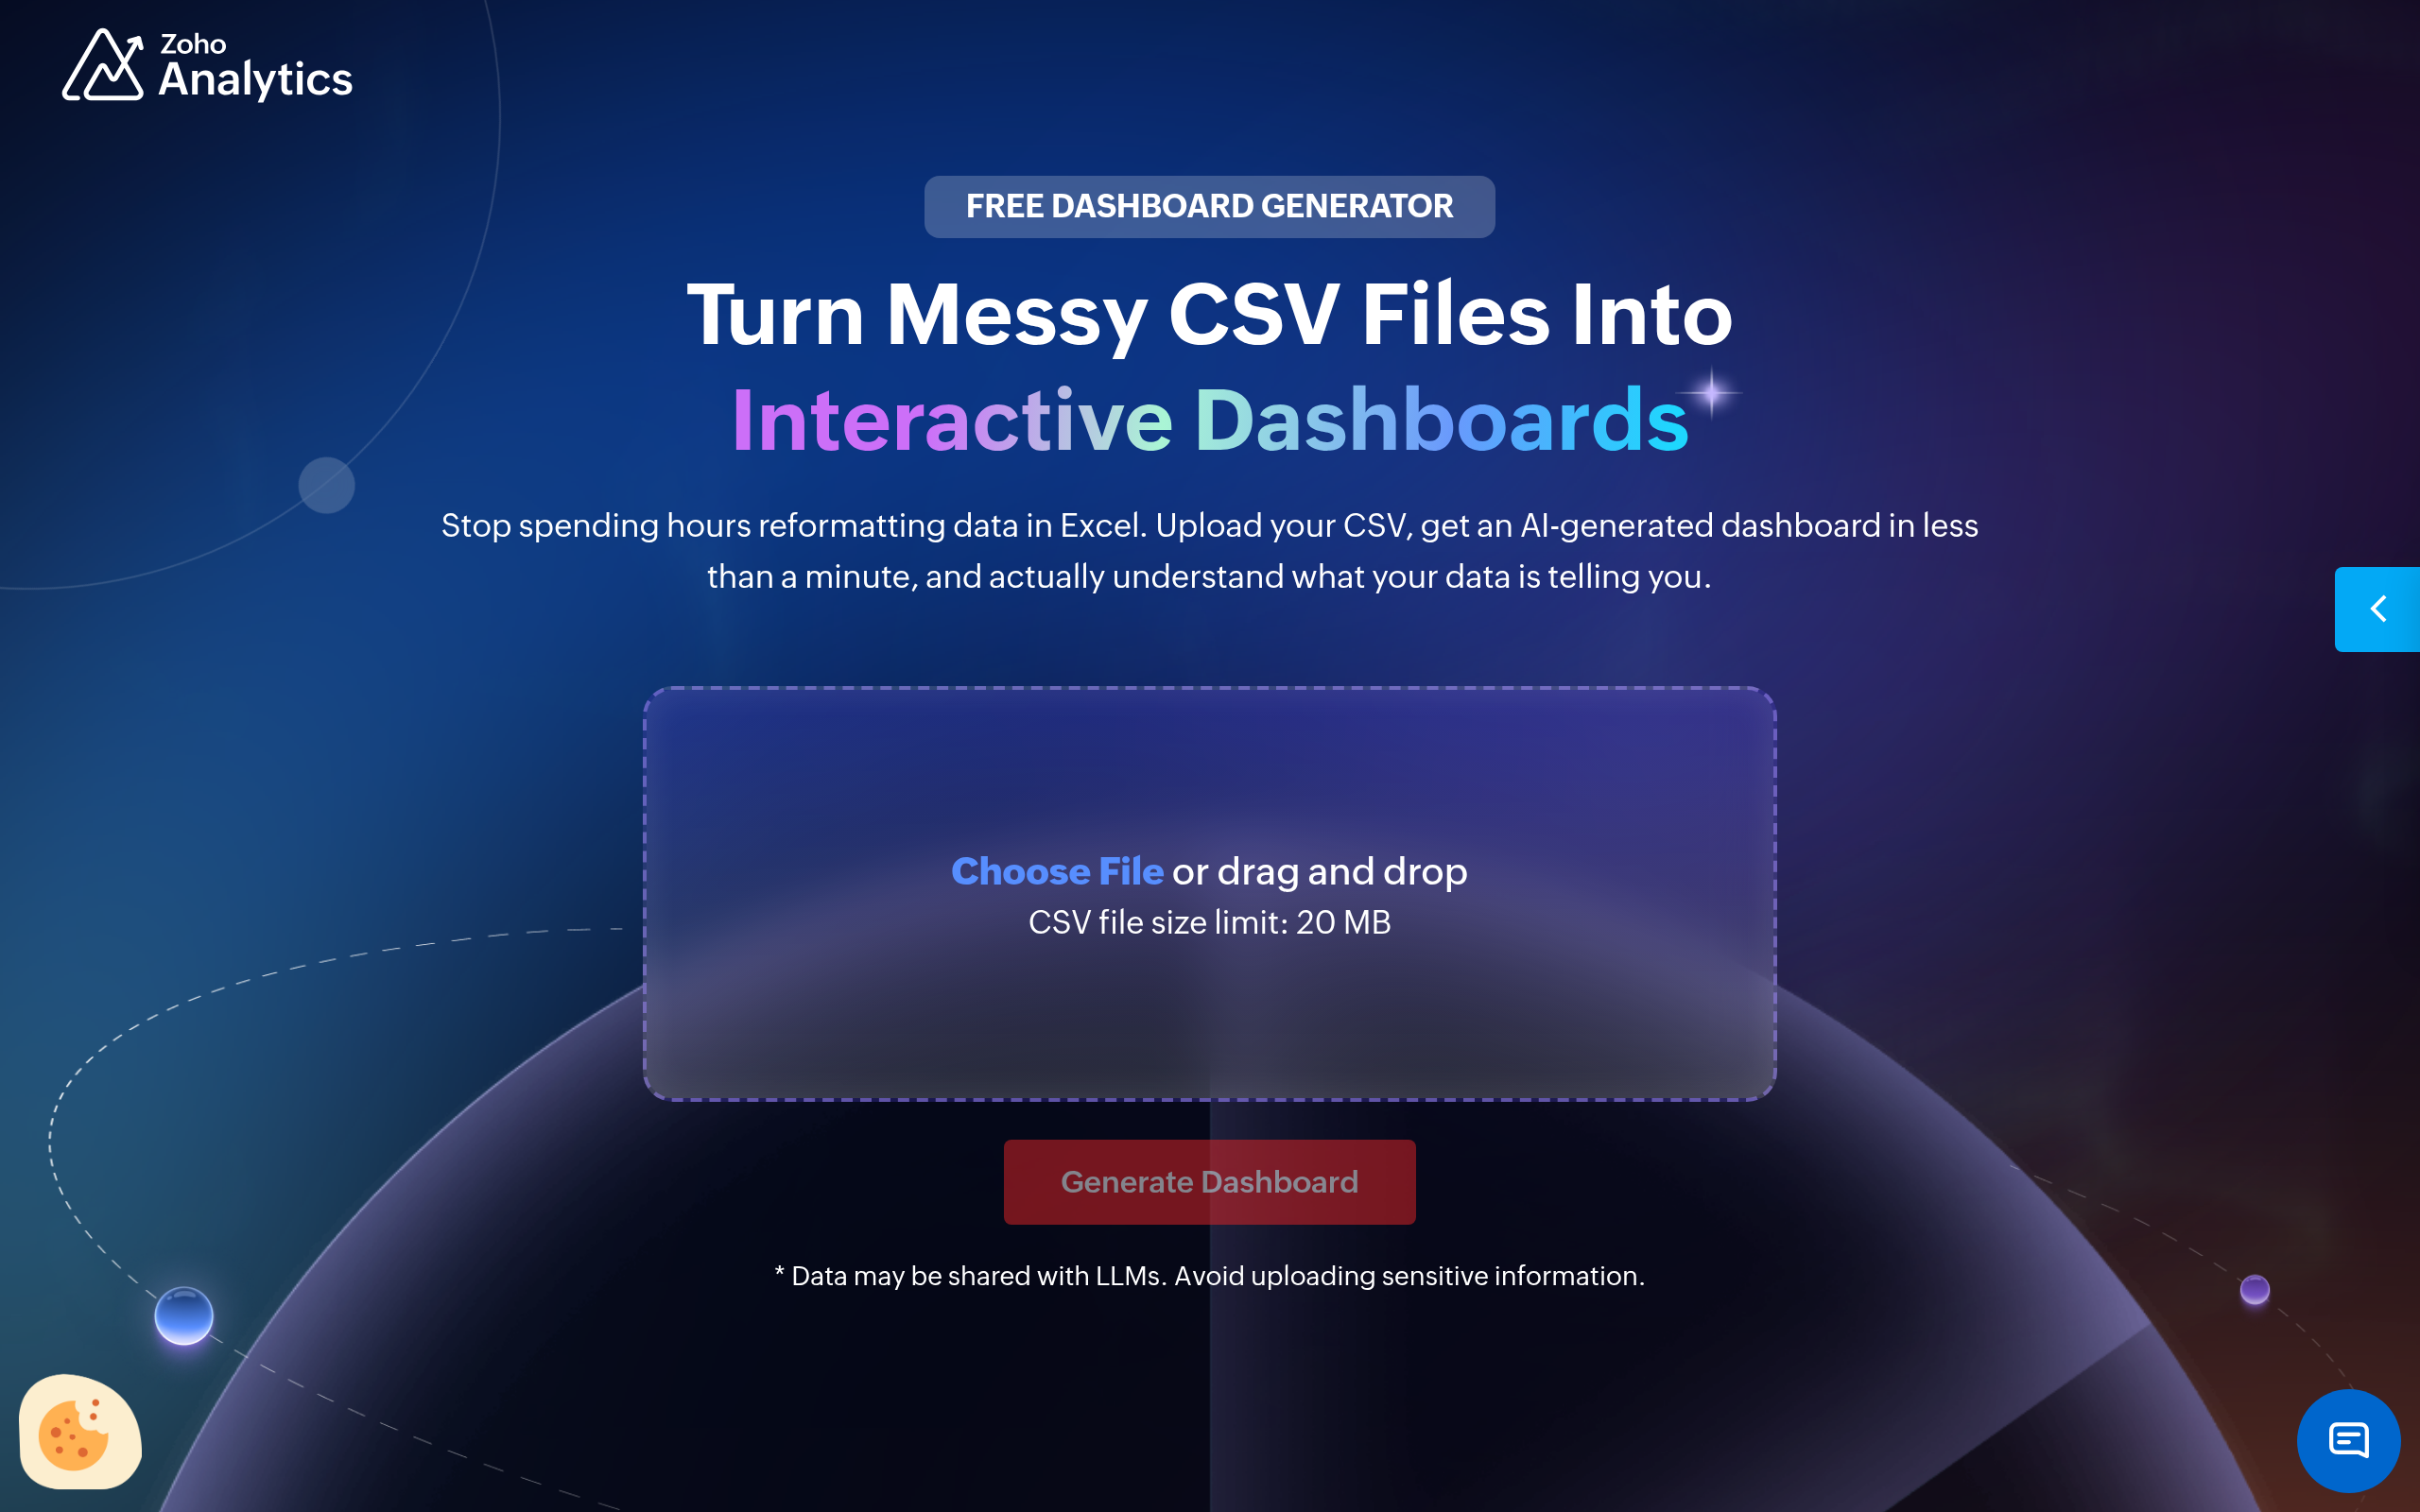
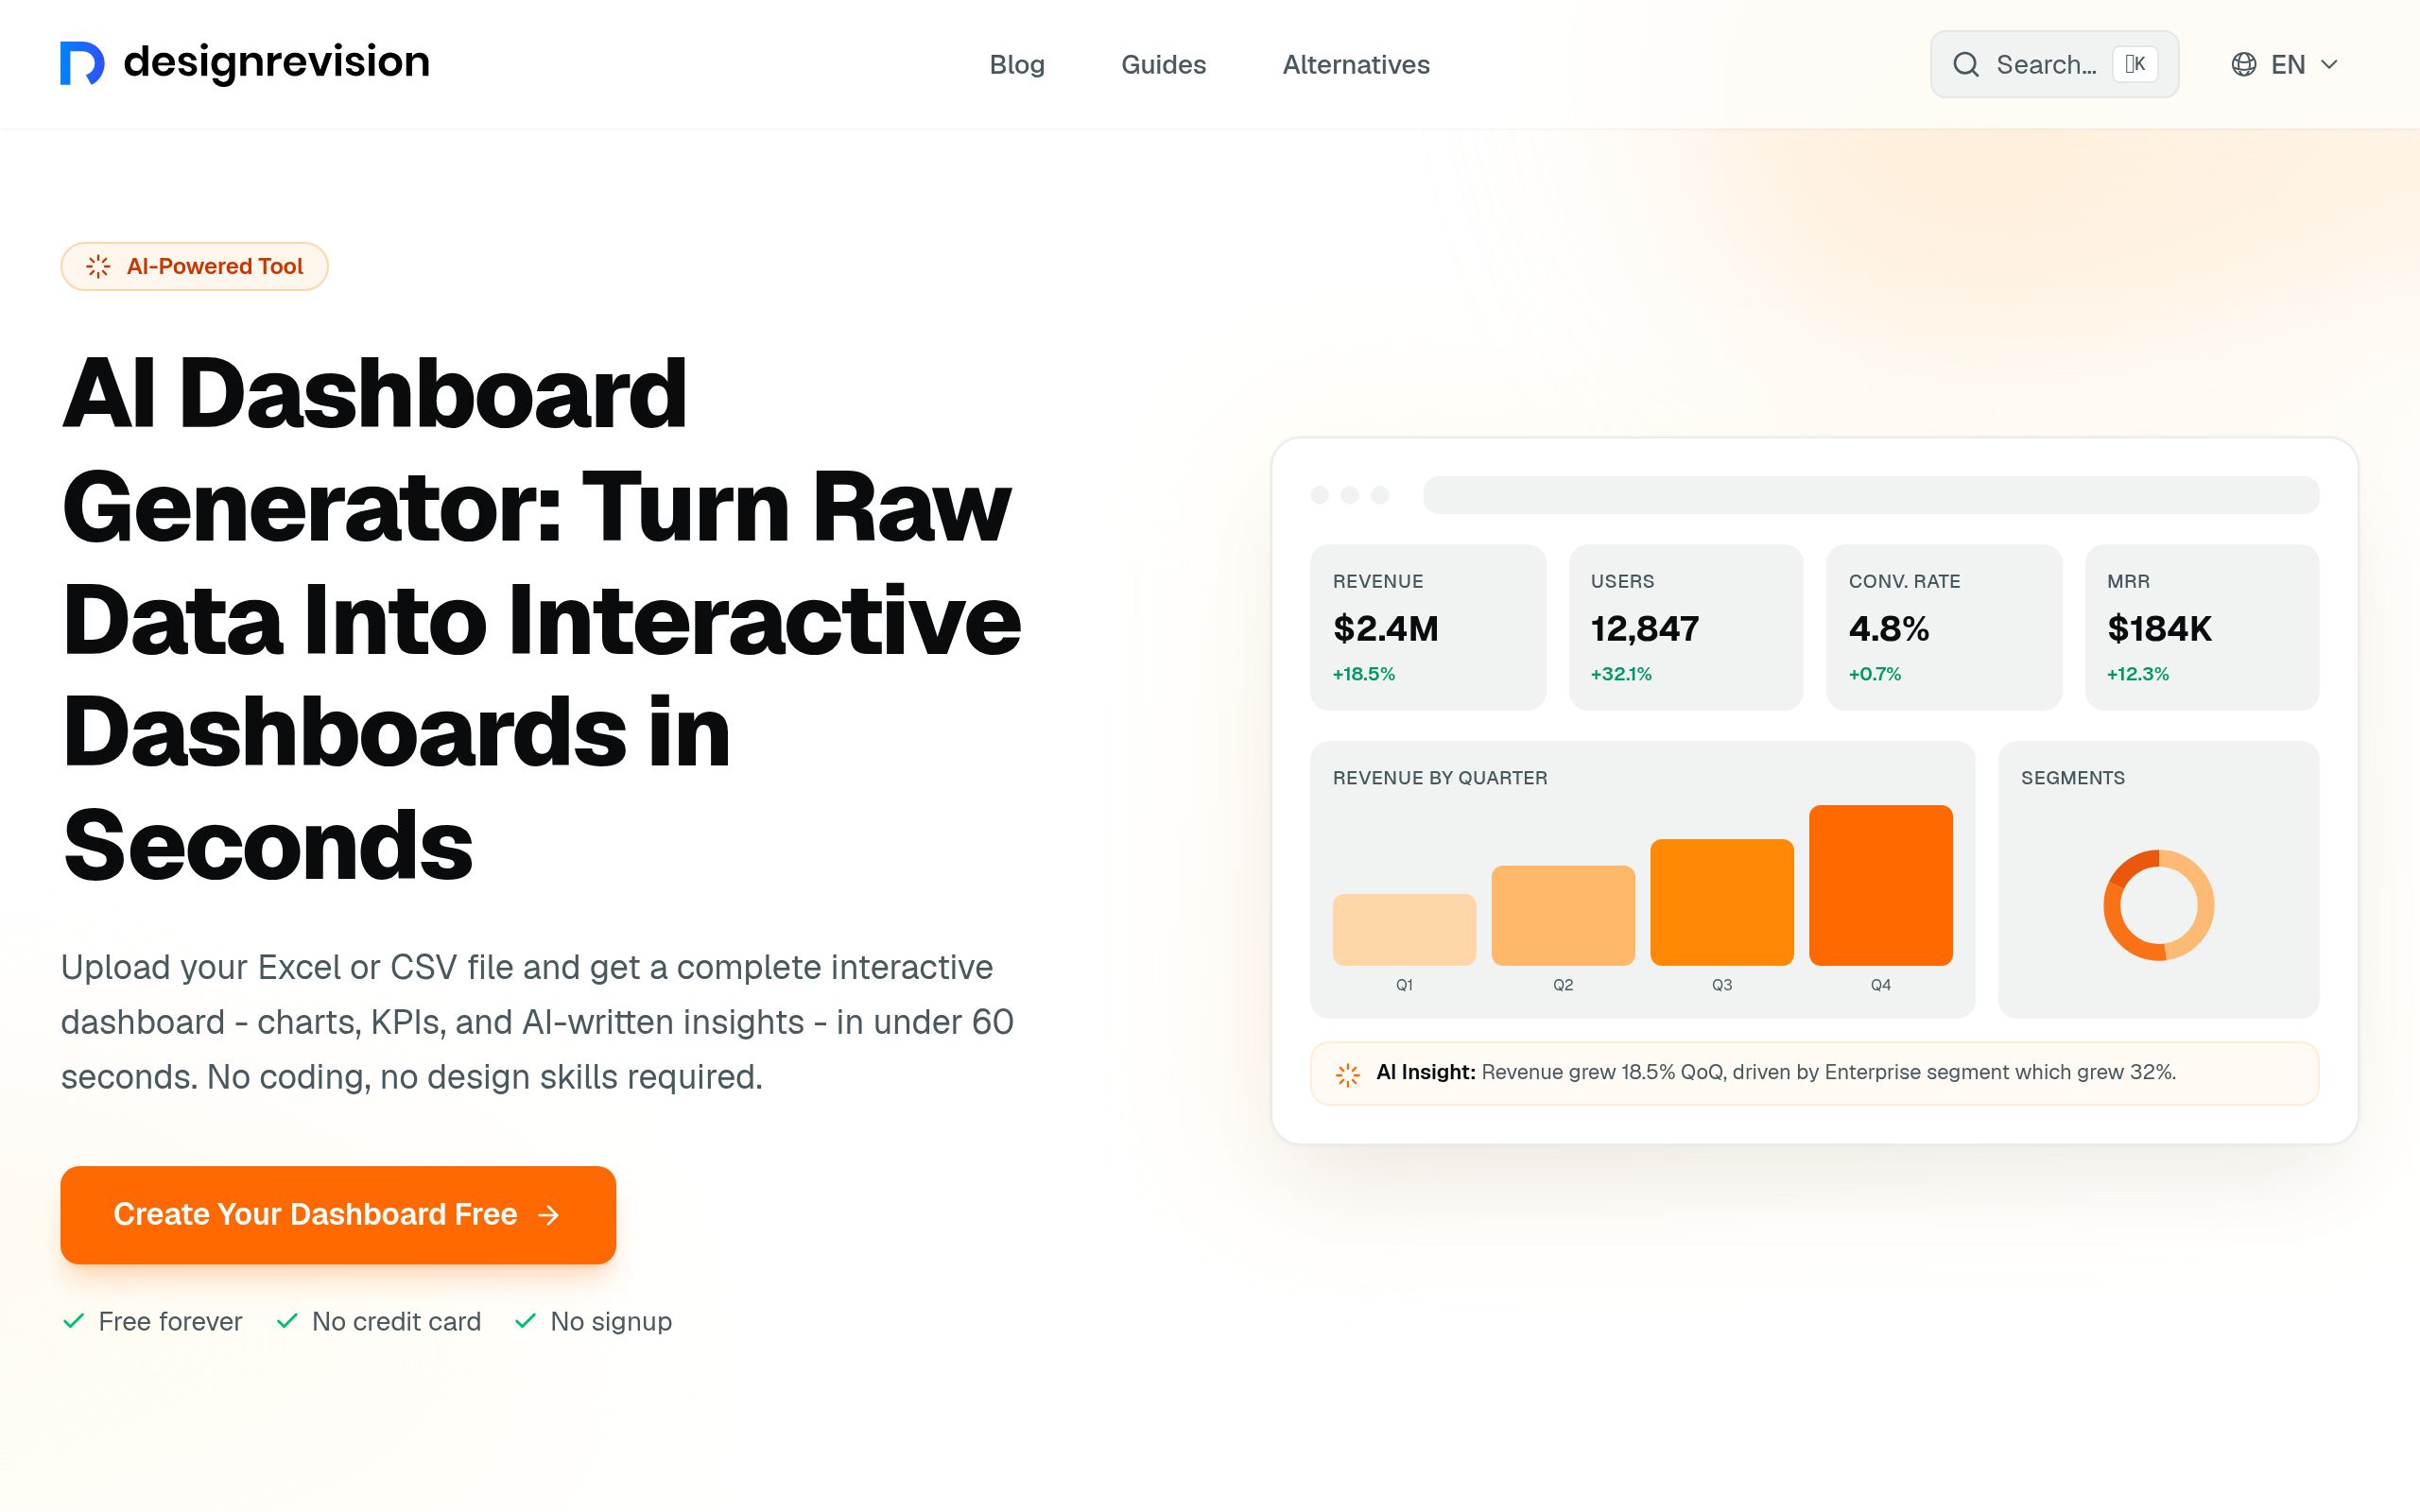
Based on Comparee's ranking, top alternatives include Free Dashboard Generator, AI Dashboard Generator, Coupler.io. See the full ranked list on our Bricks alternatives page.
How does Comparee rate Bricks?
Bricks has a Comparee Score of 71/100 — a transparent, rule-based rating from catalog signals (data completeness, pricing transparency, category fit). Affiliate partnerships never influence the score.
Comparee Score: 71/100
Transparent, rule-based — never influenced by partnerships. How it works
Top Bricks alternatives


Try Bricks
Free trial available — test it before you commit.
Visit Bricks ↗