AI Data Analysis & Business Intelligence: A 2026 Guide
AI for data analysis and BI in 2026 — how AI helps with dashboards, querying data in plain language, and the best tools like Holistics and Coefficient.
Key takeaways
- AI makes data analysis faster and more accessible — query data in plain language, auto-build dashboards, and surface insights.
- The big shift: you no longer need to be an analyst to ask your data a question and get an answer.
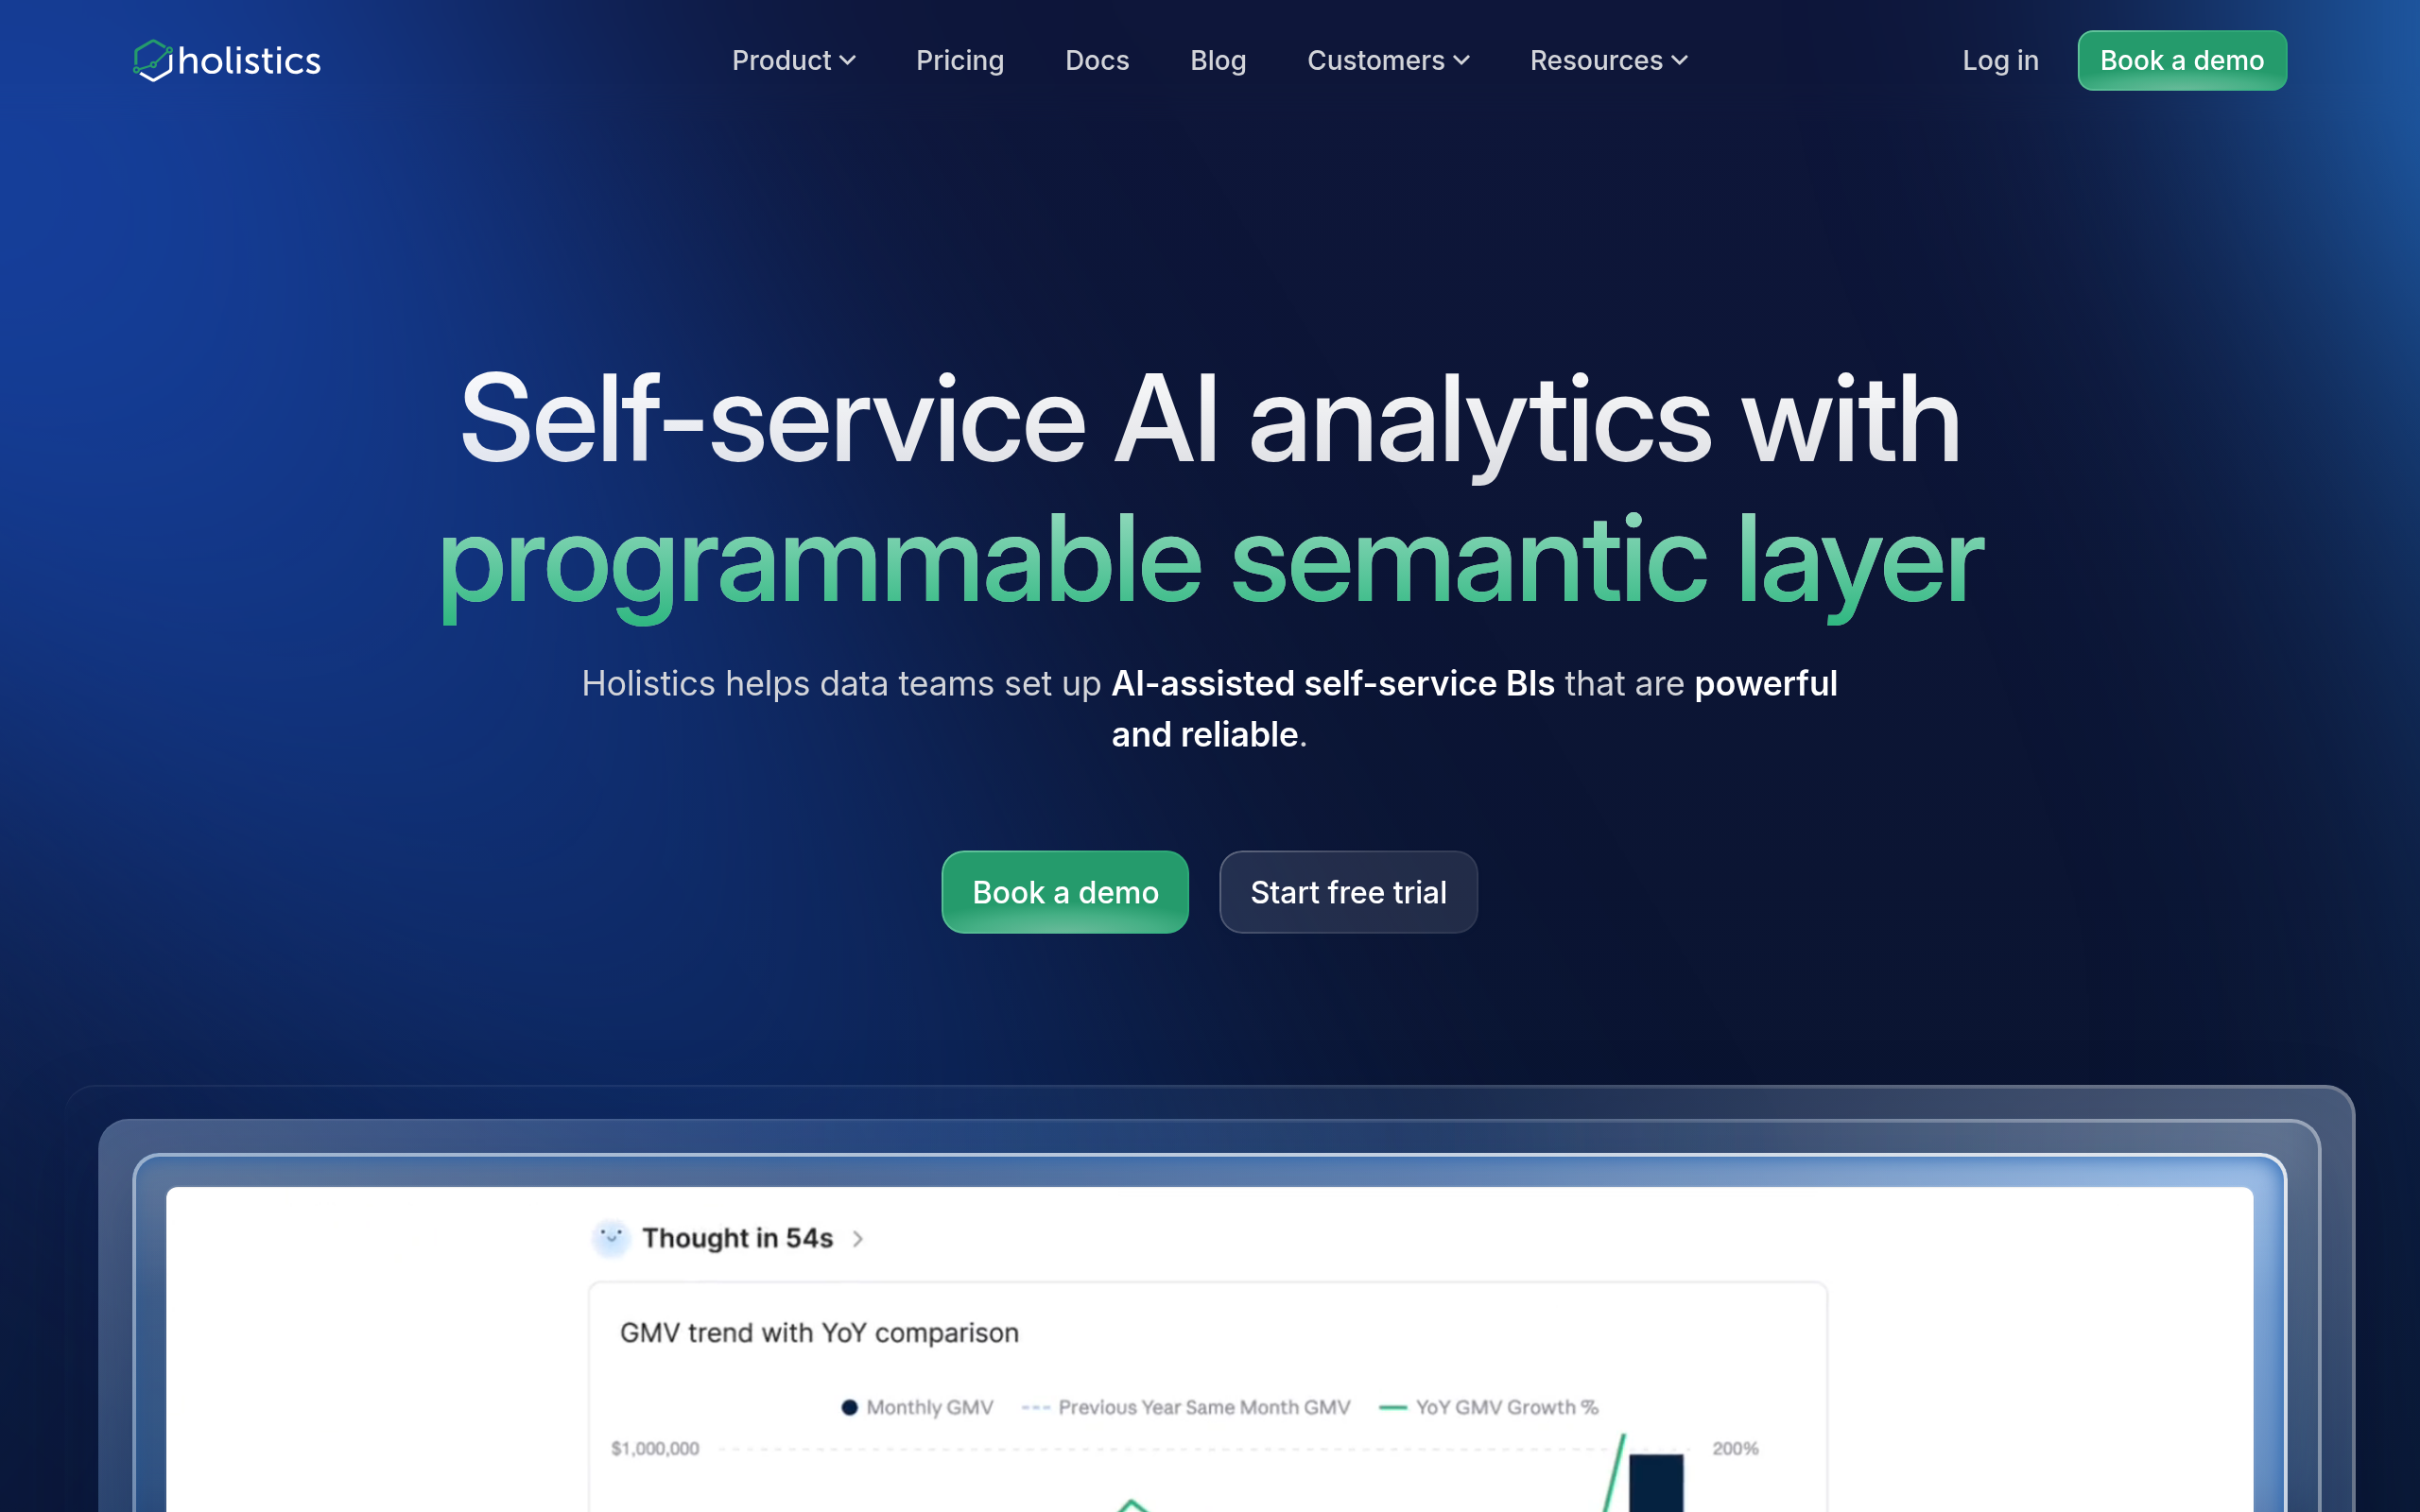
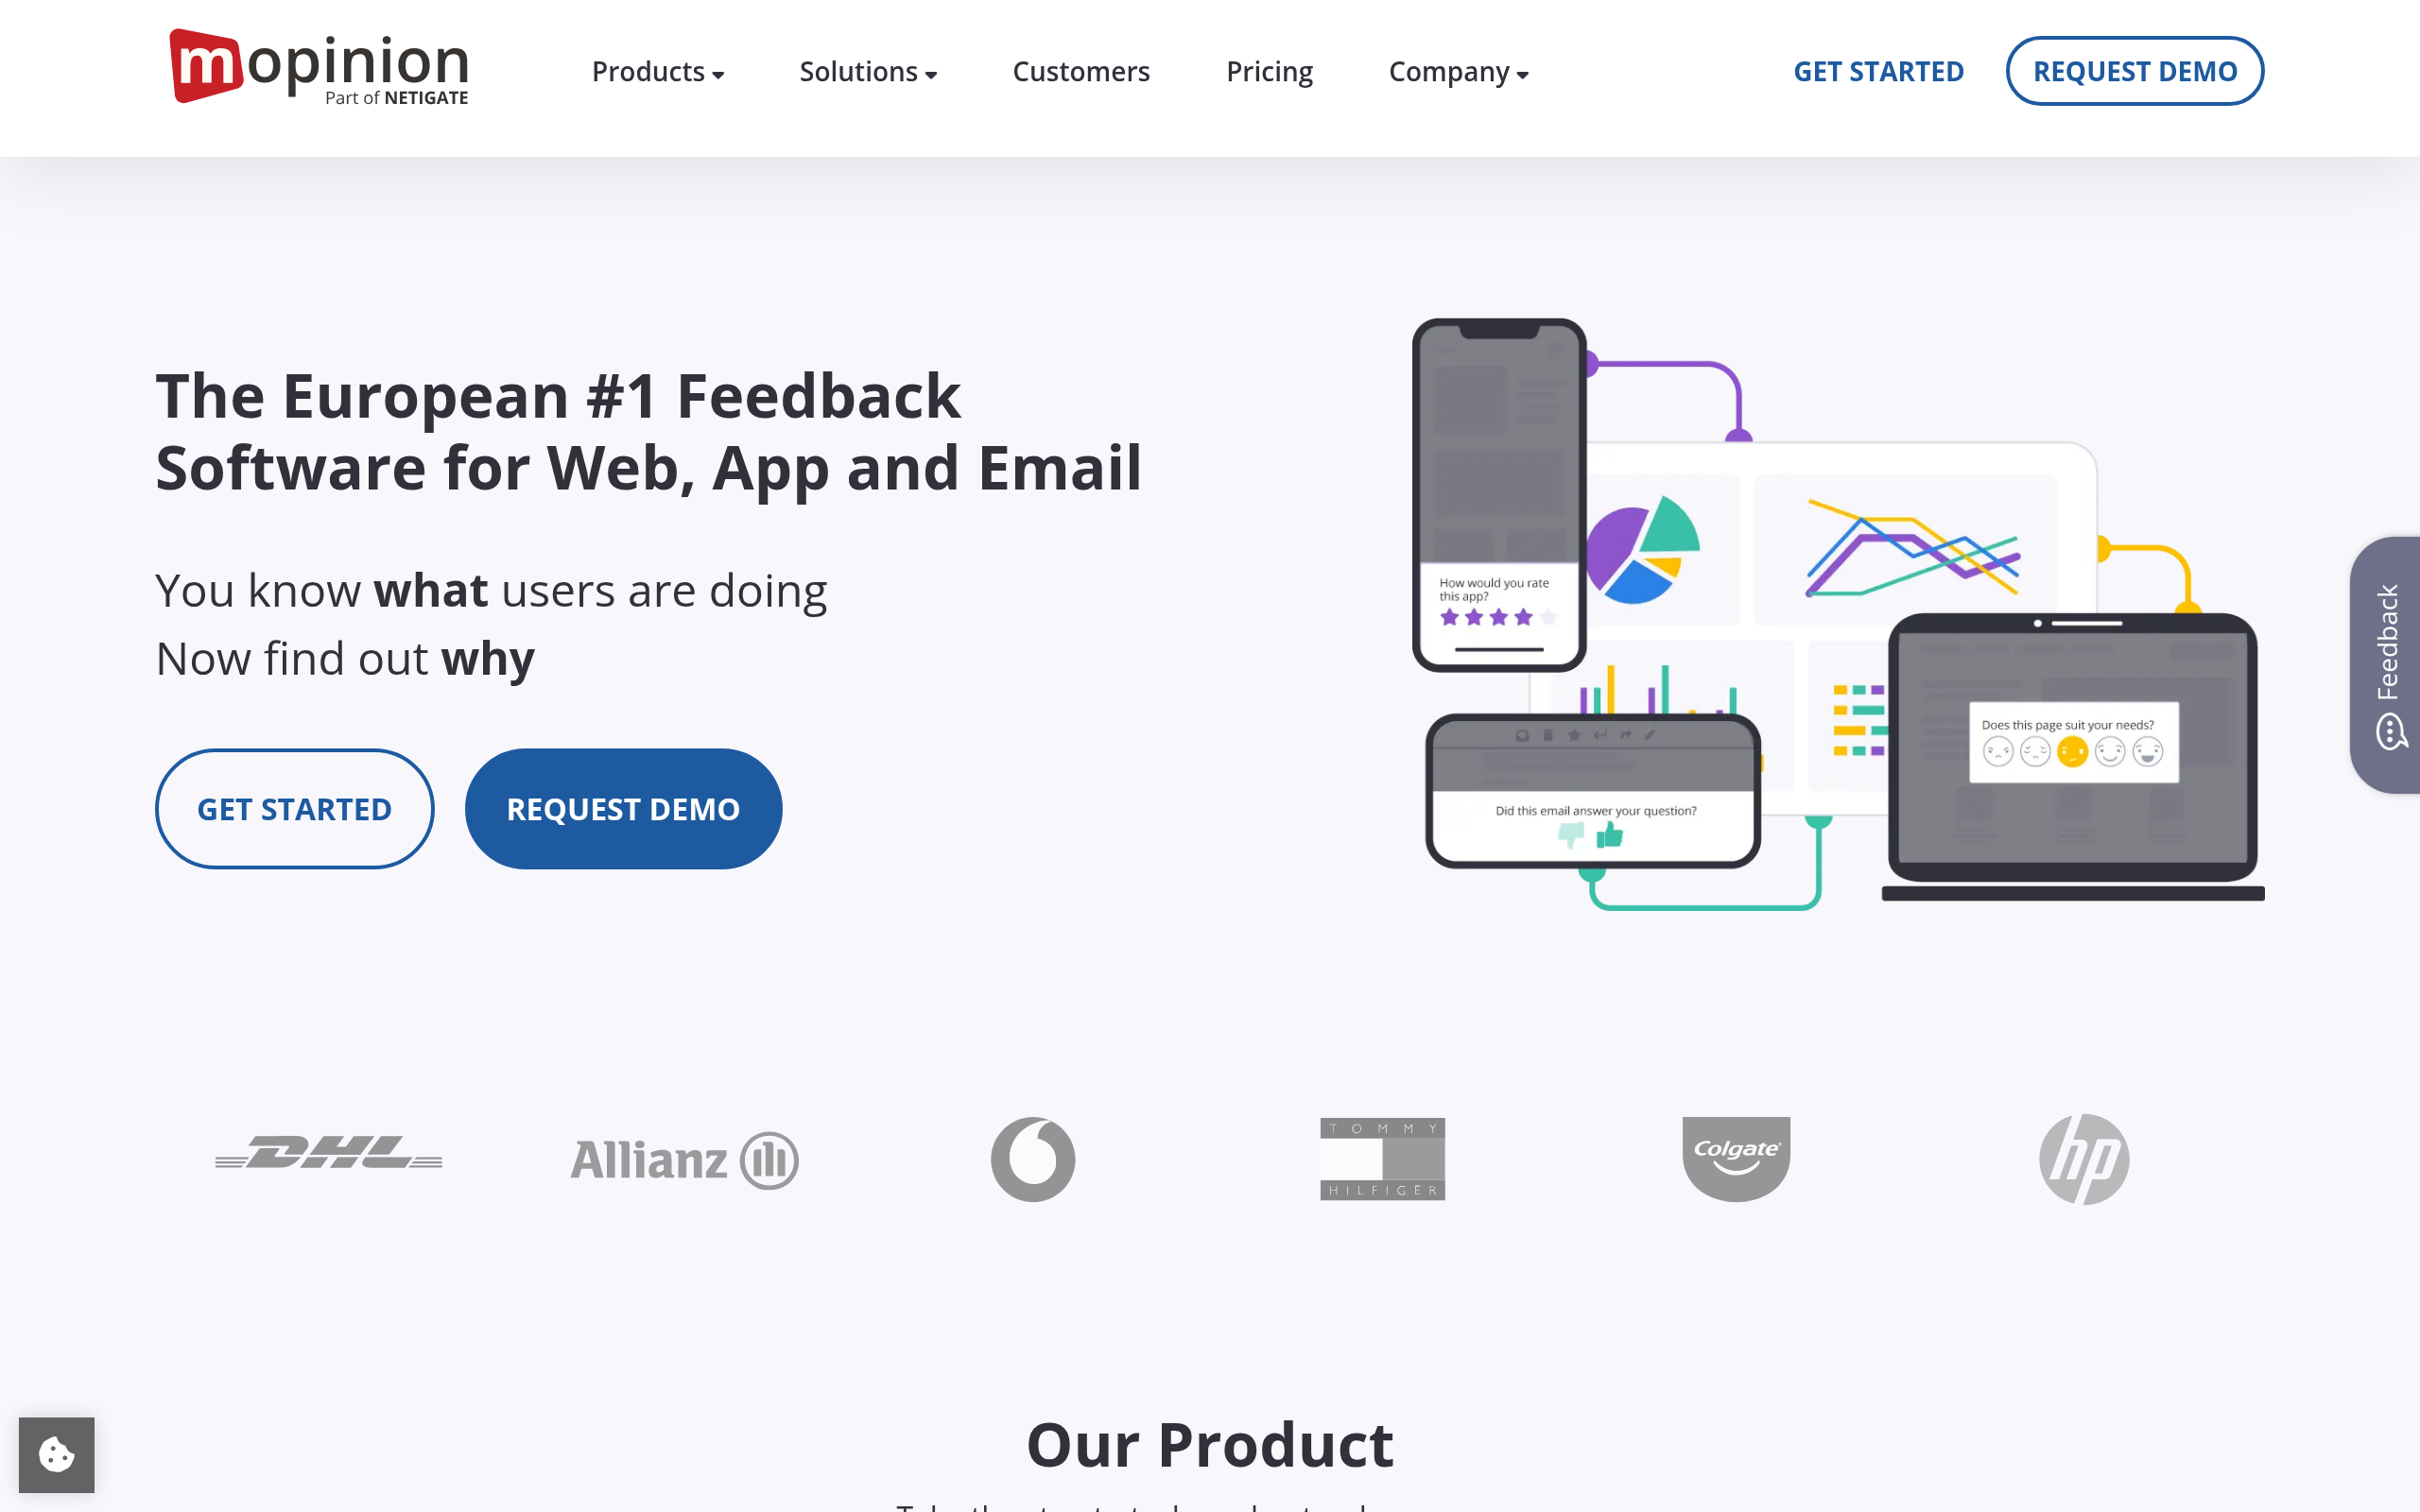
- Best tools: Holistics for modern BI, Power BI Templates for Microsoft users, Coefficient and Coupler.io for live data in spreadsheets, Mopinion for feedback.
- AI assists analysis but does not replace judgement — verify insights and question the data.
- Match the tool to your stack and whether you need dashboards, spreadsheets, or feedback analytics.
AI makes data analysis and business intelligence faster and far more accessible — you can ask questions of your data in plain language, auto-generate dashboards, and surface insights without being a trained analyst. For years, getting answers from data meant either knowing SQL or waiting in a queue for the analytics team. AI is dismantling that barrier: it translates plain-English questions into queries, builds visualisations automatically, and highlights what is interesting. The result is that more people can make data-informed decisions. But AI does not remove the need for judgement — it can mislead as easily as inform if you do not question the data. This guide covers how AI helps, the best tools, and how to use them well.
How AI is changing data analysis
The biggest change is accessibility. Traditionally, the gap between a business question ("which regions are slowing down?") and an answer required technical skill or an analyst's time. AI closes that gap by letting people ask questions in natural language and get charts and answers back. Beyond access, AI automates the tedious parts — building dashboards, cleaning and joining data, and generating reports — and it surfaces insights proactively, spotting trends and anomalies a human might miss in a sea of numbers. The net effect is a shift from "data analysis is a specialist function" to "anyone can interrogate the data, with specialists focusing on the hard problems."
What AI can (and can't) do with your data
AI is excellent at the mechanical and the exploratory: writing queries from plain language, building first-draft dashboards, summarising datasets, and flagging patterns. It is not a substitute for understanding your business or your data's limitations. AI will happily produce a confident-looking chart from flawed, biased or misunderstood data — so the human job shifts to asking the right questions, validating that the data actually answers them, and interpreting results in context. The danger is automation bias: trusting an AI-generated insight because it looks authoritative. The rule is simple — let AI accelerate the analysis, but keep a human deciding what the numbers mean.
Best AI data and BI tools in 2026
| Need | Best tool |
|---|---|
| Modern BI / dashboards | Holistics |
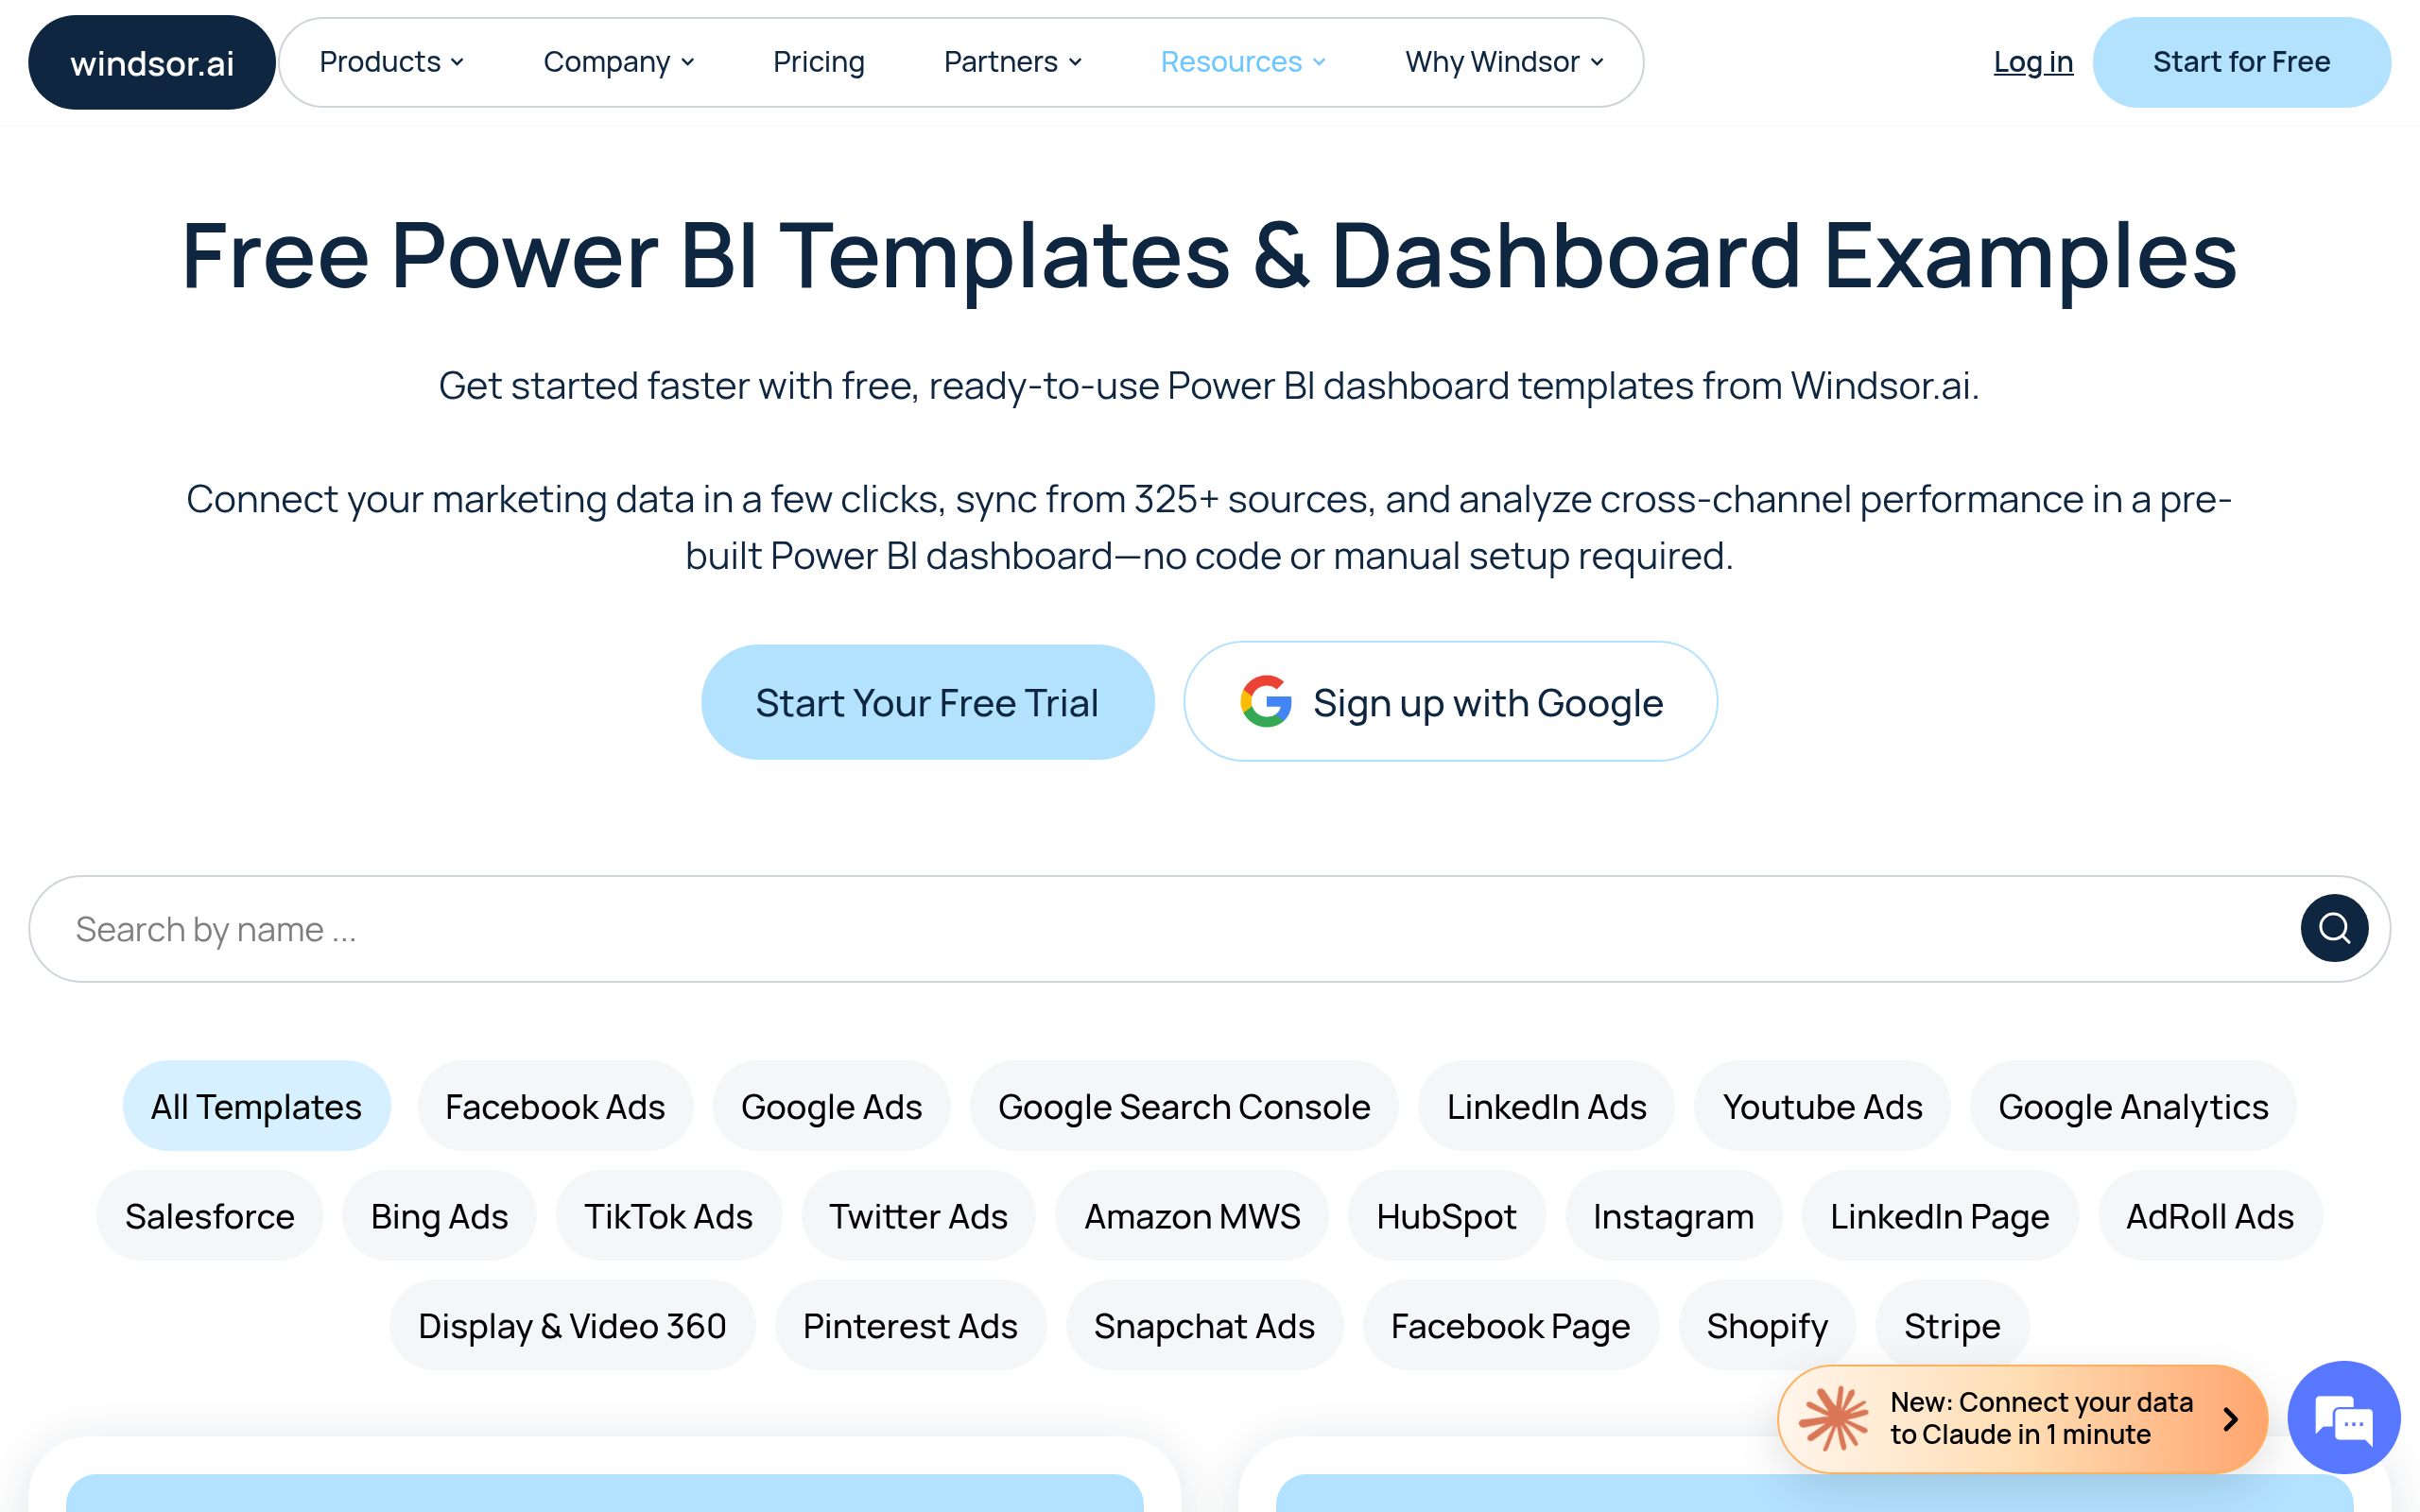
| Microsoft ecosystem | Power BI Templates |
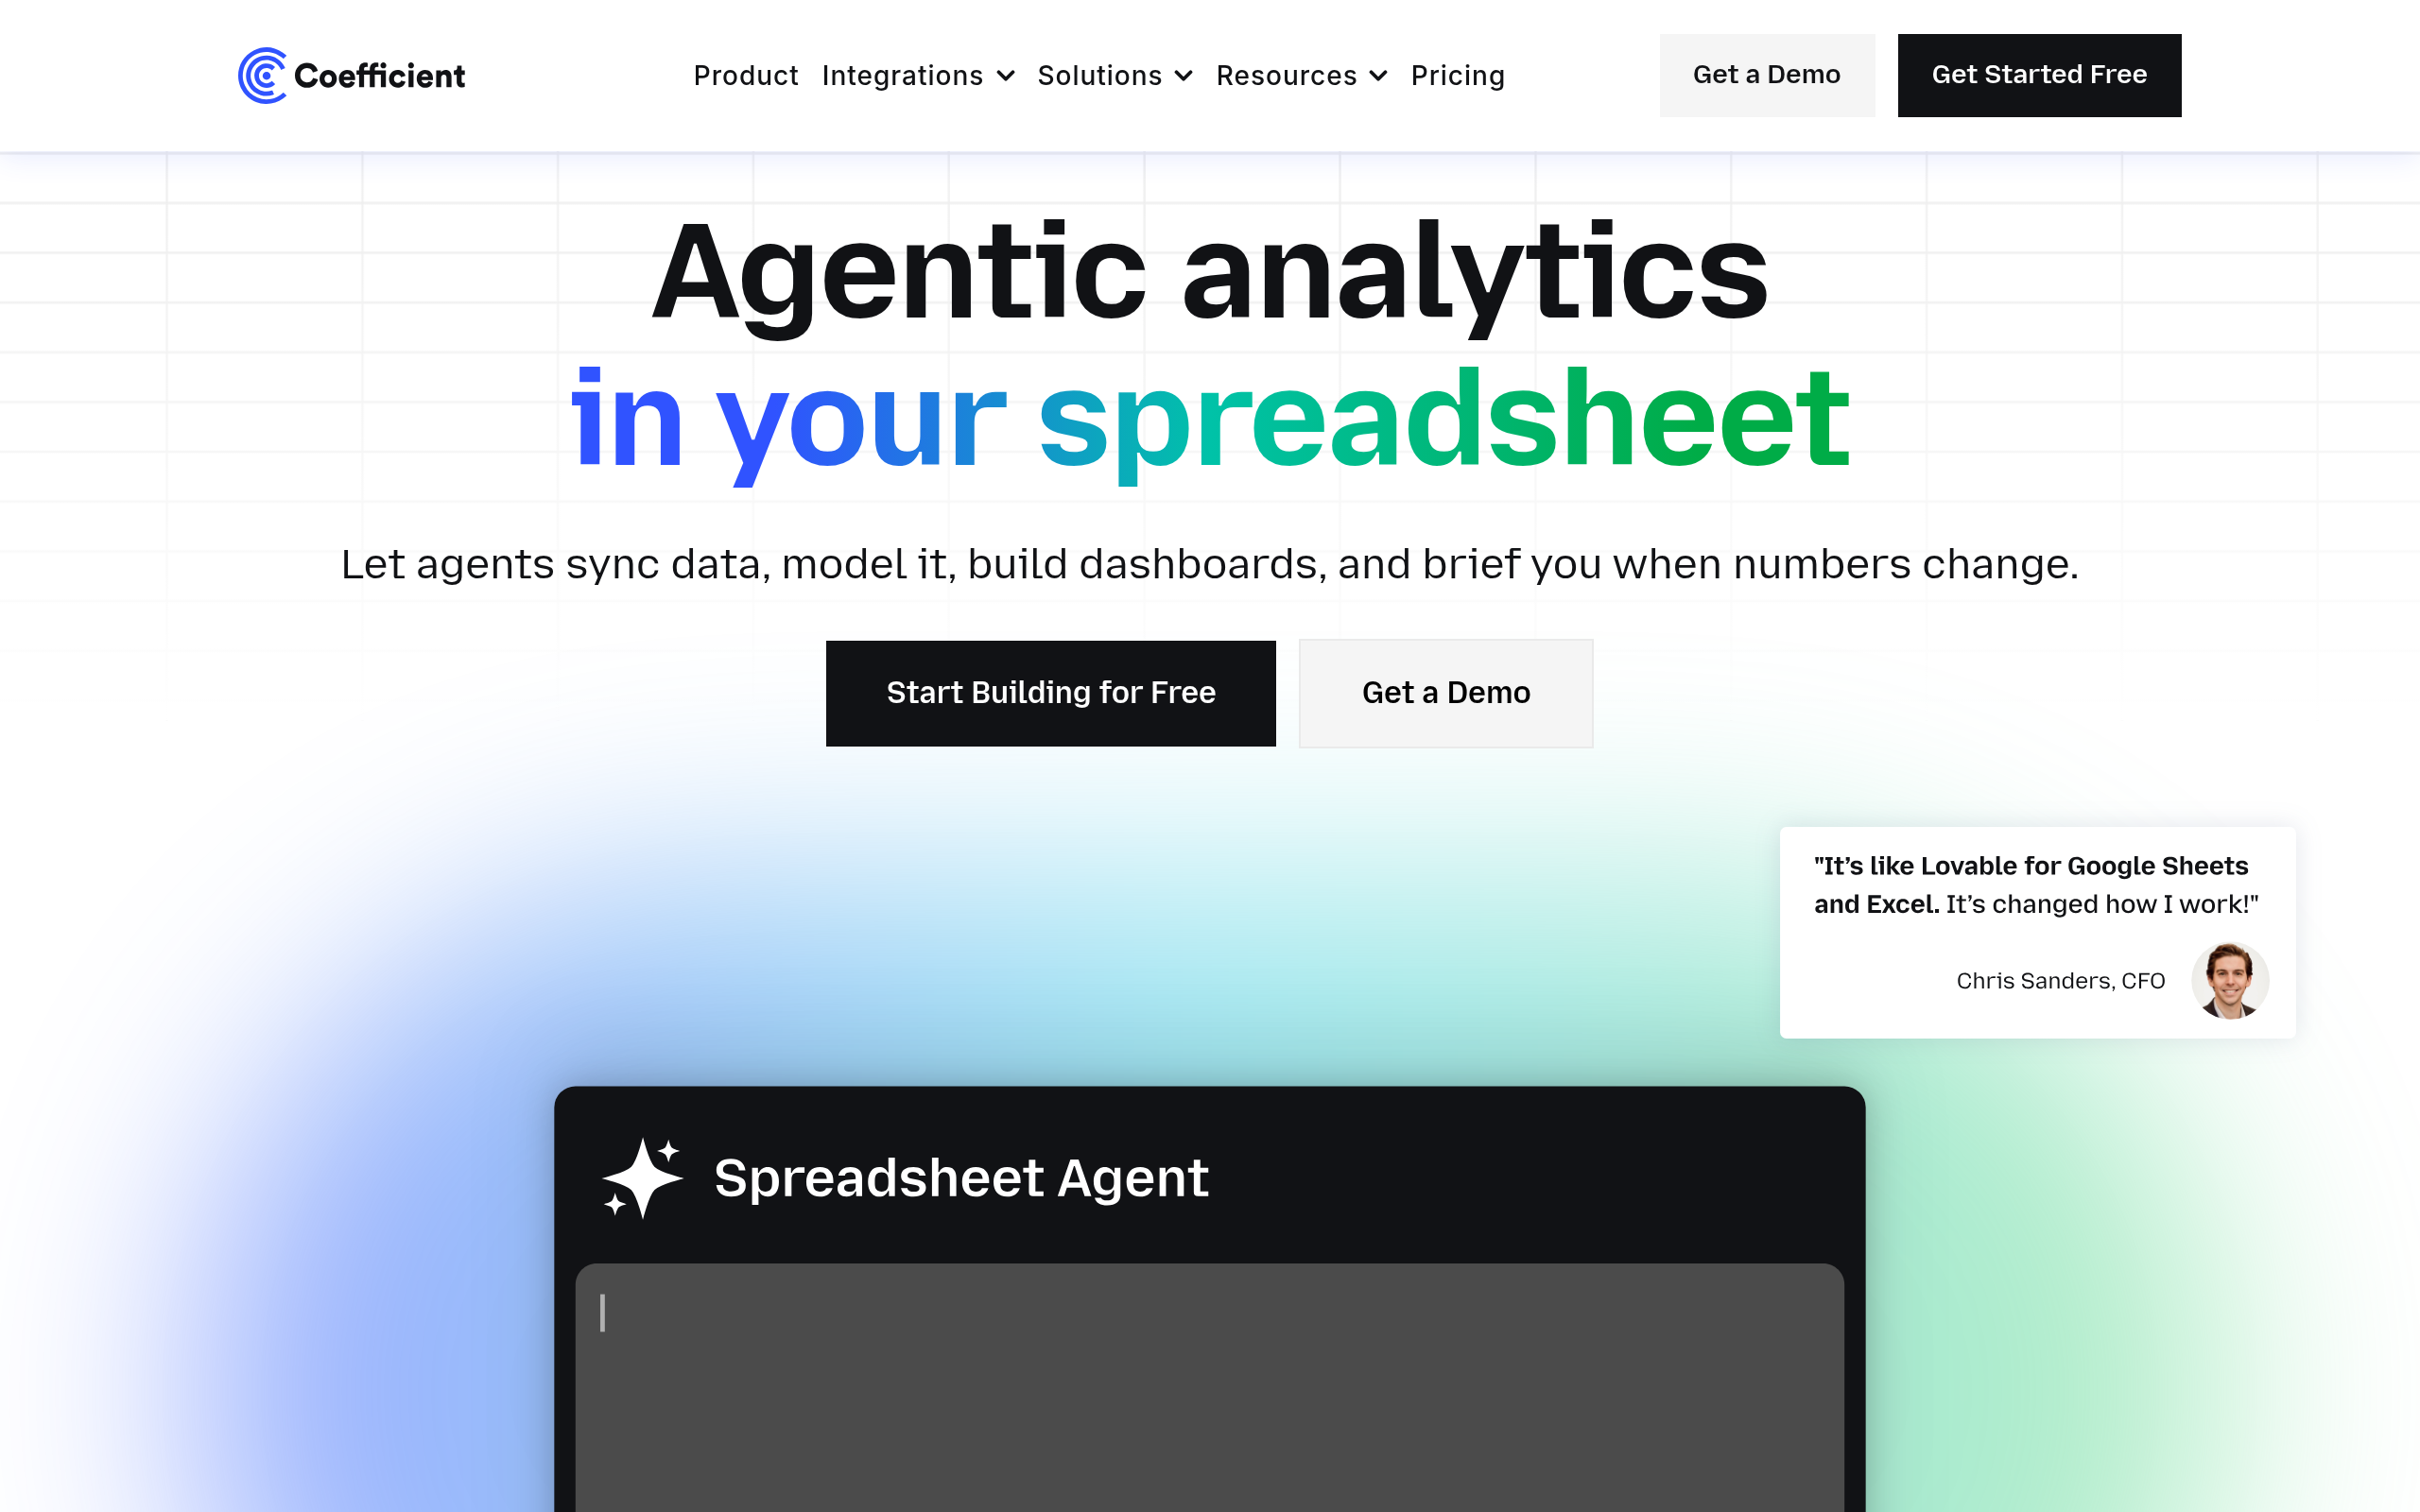
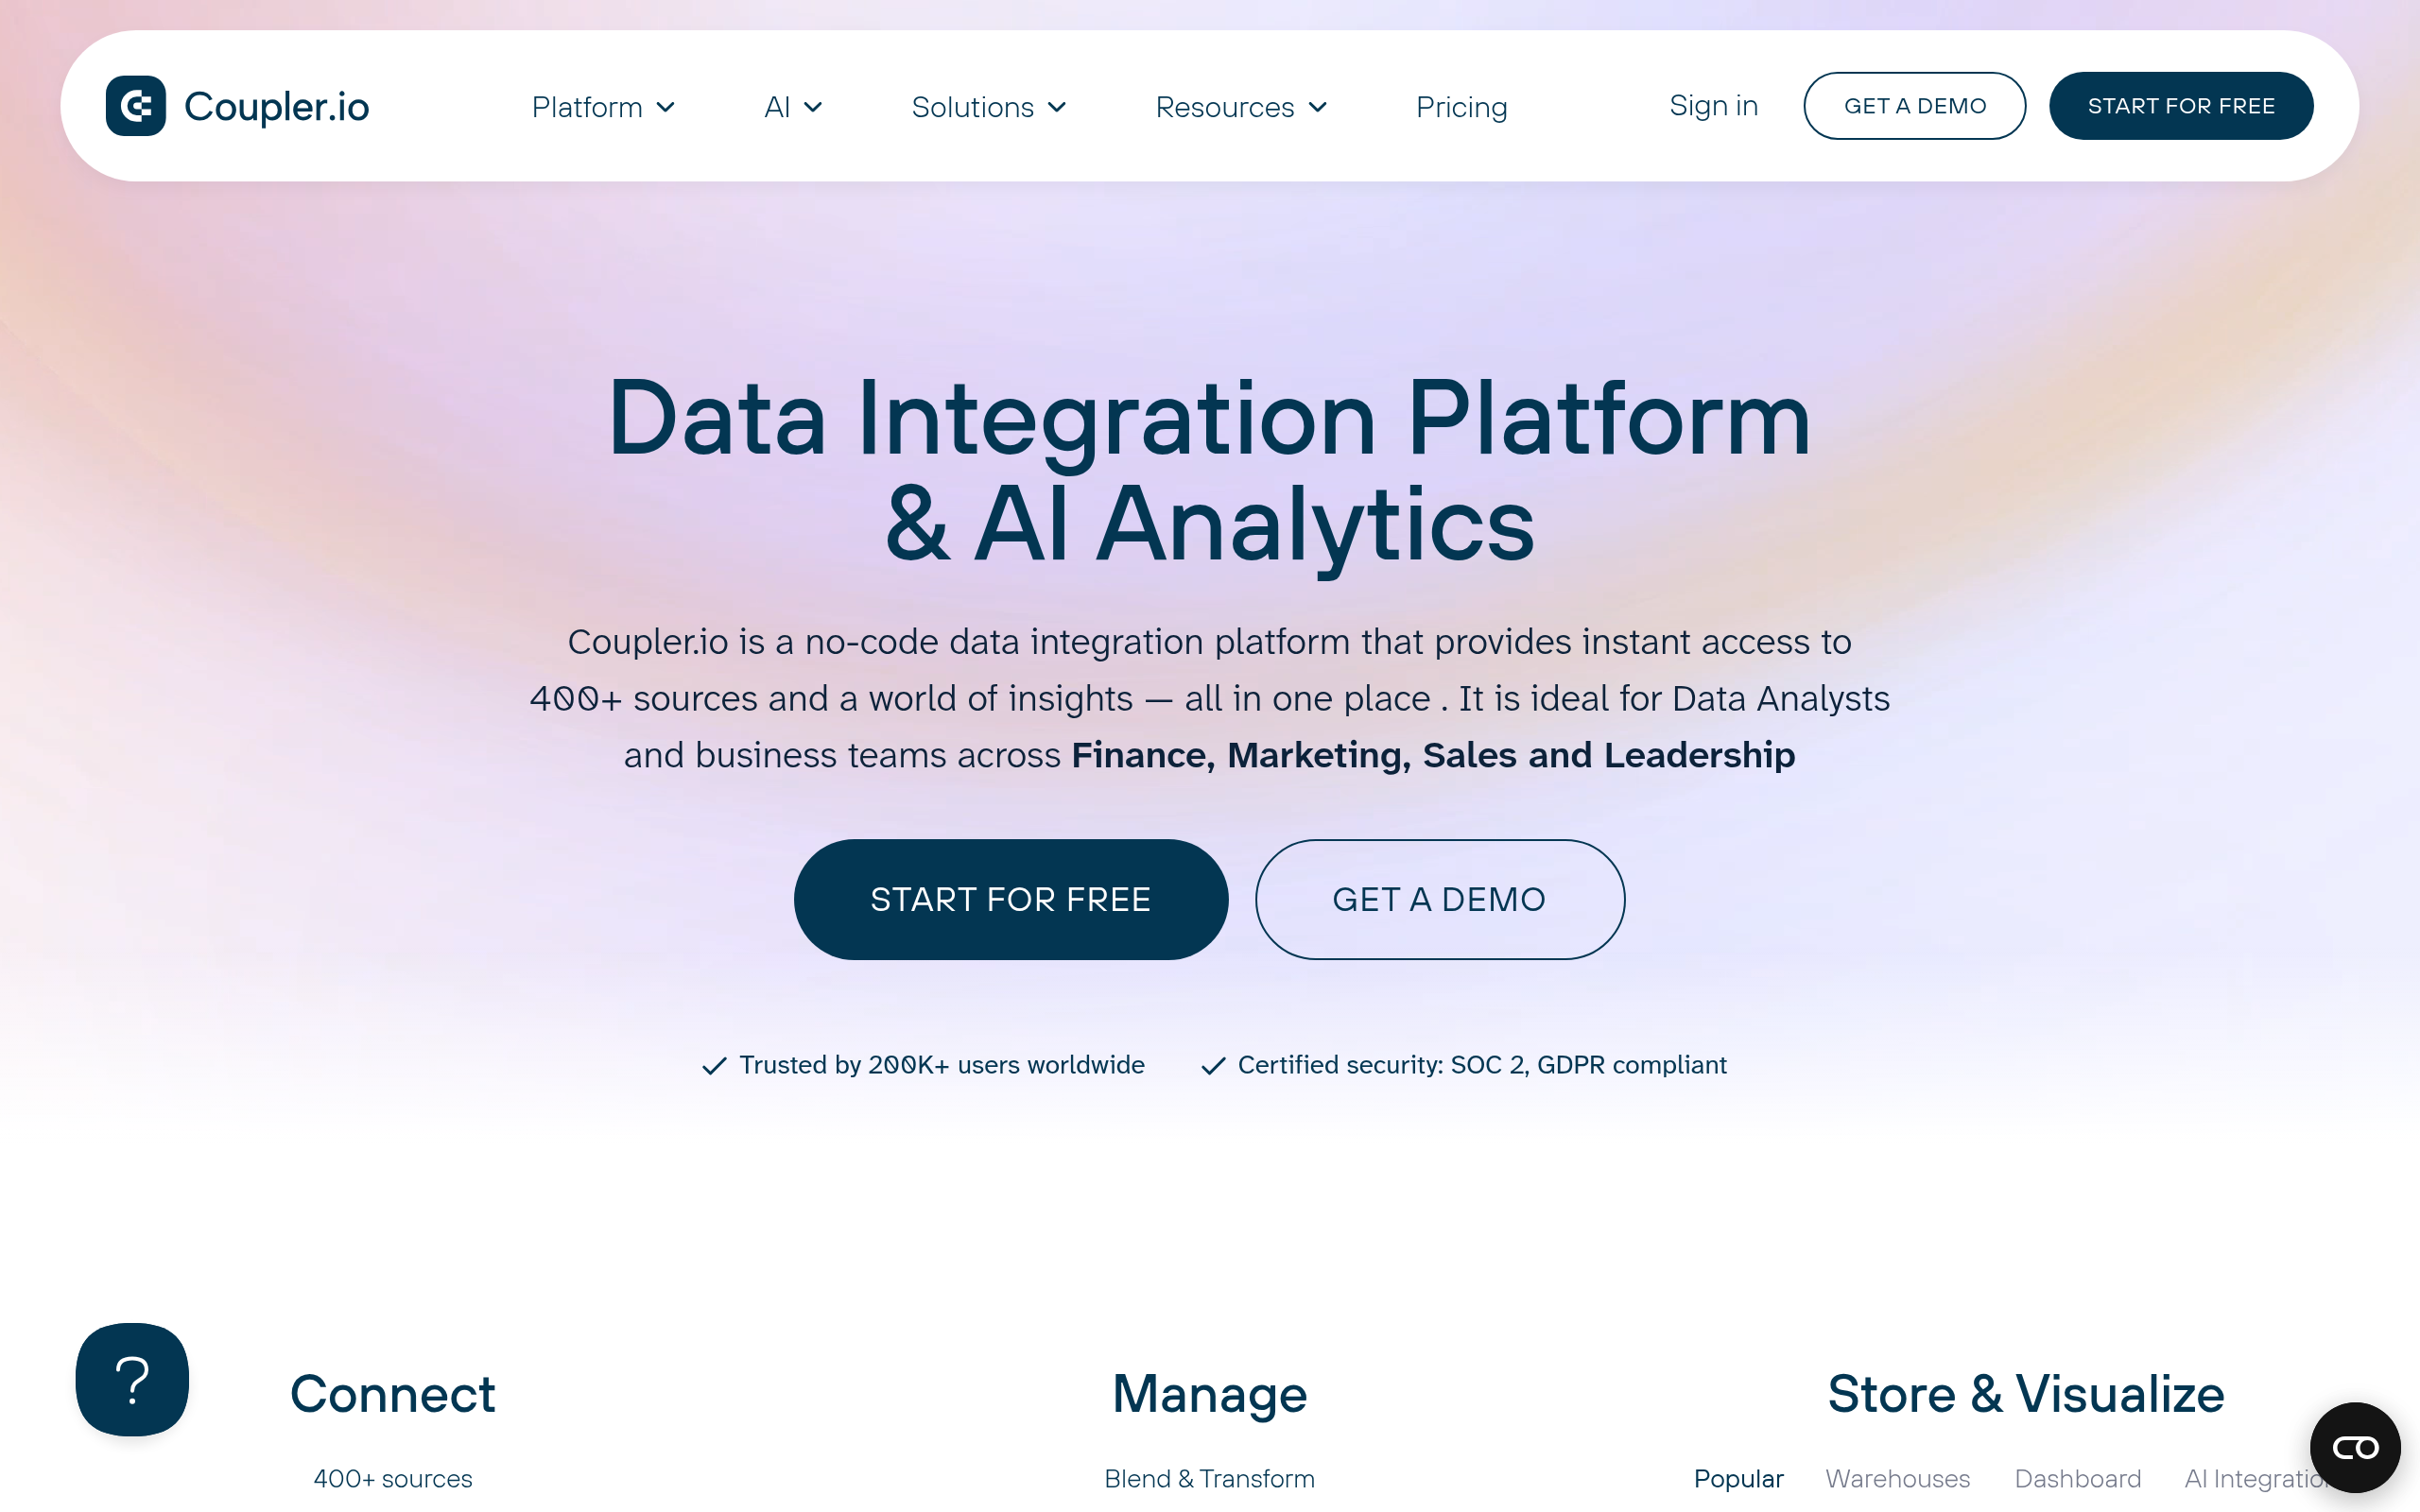
| Live data in spreadsheets | Coefficient, Coupler.io |
| Customer feedback | Mopinion |
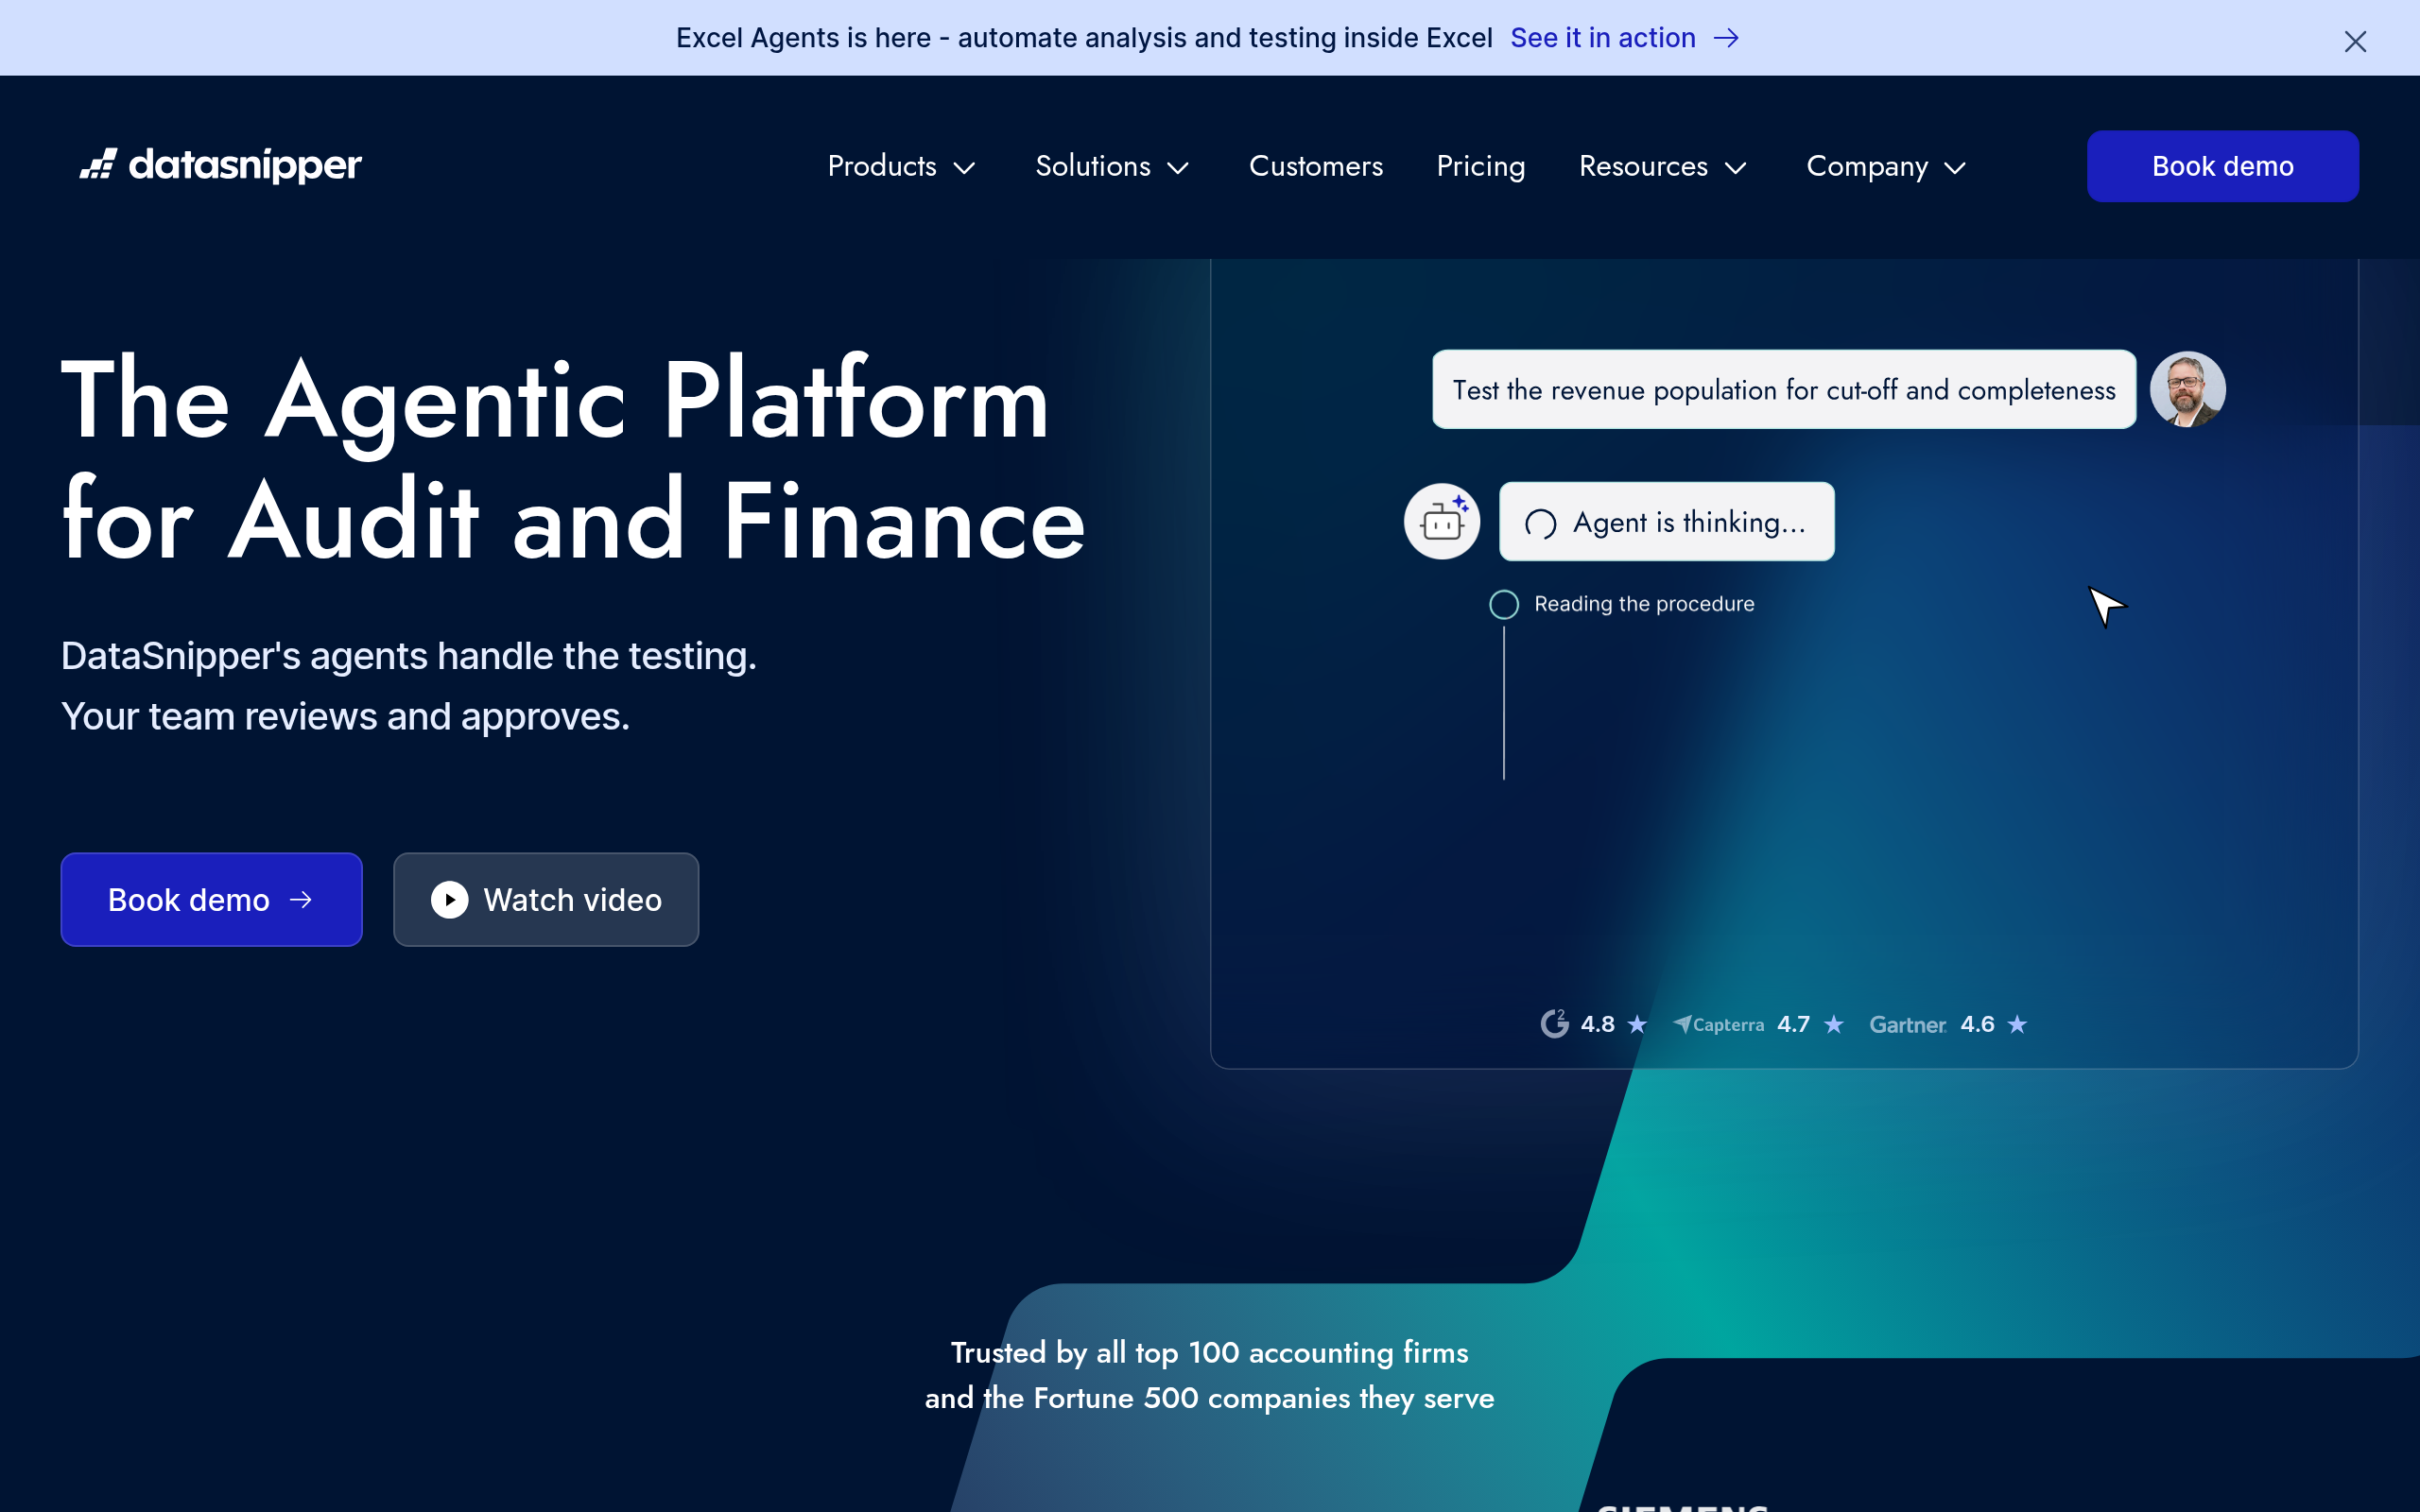
Choose by your stack and how you work with data. For a modern, SQL-friendly BI platform with dashboards and self-service analytics, Holistics is a strong choice. For teams in the Microsoft ecosystem who want faster results, Power BI Templates provide ready-made dashboards. For people who live in spreadsheets and need live data, Coefficient pulls real-time data into your sheets and Coupler.io integrates and automates data from many sources for reporting. For auditing and document data, DataSnipper helps, and for customer feedback analytics, Mopinion specialises. Compare more in our Tableau alternatives, Looker alternatives and Airtable alternatives guides and the data & BI category.
How to put AI analytics to work (step by step)
- Define the business question clearly — vague questions get vague answers, from AI or anyone.
- Connect clean data — AI cannot fix bad inputs; garbage in, confident garbage out.
- Pick the right tool for your stack (BI platform, spreadsheet, or feedback) using the guidance above.
- Ask in plain language and let AI build the query and visualisation.
- Validate the result — does the data actually answer the question? Is it complete and unbiased?
- Interpret in context — the human decides what the numbers mean and what to do.
Why AI matters for data and BI now
For most of business history, data has been simultaneously abundant and inaccessible — companies collect enormous amounts of it, yet getting a clear answer to a simple question required either technical skill or a queue for the analytics team. That bottleneck meant decisions were often made on gut feel not because data was unavailable, but because it was too slow to reach. AI breaks the bottleneck by translating plain-language questions into queries and visualisations, so the marketer, the ops lead and the founder can interrogate the data directly. The impact compounds: when more people can ask and answer data questions themselves, decisions across the organisation become more evidence-based, and the specialist analysts are freed to tackle the genuinely hard, high-value problems instead of fielding routine requests. The shift is from data as a gated resource to data as a shared, conversational tool — and that is a meaningful change in how organisations think and decide.
The discipline that keeps AI analytics honest
The same accessibility that makes AI analytics powerful also makes it risky, because a confident-looking chart carries authority whether or not the underlying analysis is sound. AI will cheerfully answer a question the data cannot actually support, build a visualisation on a flawed join, or surface a correlation that means nothing — and present all of it with the same polish as a genuine insight. The antidote is a habit of healthy skepticism: always ask whether the data actually answers the question, whether it is complete and unbiased, and whether the result makes sense in the context of the business. This is where human judgement remains irreplaceable. The best practice is to let AI do the heavy lifting of querying and visualising, then have a person validate and interpret before any decision is made. Used with that discipline, AI analytics is a genuine advantage; used credulously, it is a fast way to make confident mistakes.
Common mistakes with AI analytics
The biggest mistake is automation bias — accepting an AI-generated chart or insight because it looks authoritative, without asking whether the data actually supports it. AI will confidently answer questions the data cannot, build visualisations on flawed joins, and surface meaningless correlations, all with the same polish as a real finding. A related error is feeding it dirty or incomplete data and trusting the output anyway: garbage in, confident garbage out. And a third is skipping context — a number that looks alarming or impressive may be perfectly normal once you understand the business behind it. Avoid all three by validating inputs, questioning results, and keeping human interpretation between the AI and the decision.
The bottom line
AI is democratising data — letting anyone ask questions of their data in plain language and get answers, while automating the dashboards and reports that used to take specialists. Use Holistics for modern BI, Power BI Templates for Microsoft, Coefficient and Coupler.io for spreadsheets, and Mopinion for feedback. Just keep a human in charge of judgement: ask the right questions, validate the data, and interpret in context. Used that way, AI turns data from a bottleneck into a decision-making advantage for the whole team — provided you pair its speed with the human discipline to question, validate and interpret what the numbers are really telling you.
Disclaimer: AI can produce confident insights from flawed or misunderstood data. Validate inputs, question results, and keep human judgement on what the data actually means before acting.
Tools mentioned in this guide
Data Analysis & BI
AI Agents & Automation
AI Agents & Automation
AI Chatbots & Assistants
Data Analysis & BI
Data Analysis & BI
Pricing, features and model availability can change over time. Always verify current details on each tool's official website before deciding.
Frequently Asked Questions
How does AI help with data analysis?
How does AI help with data analysis?
What are the best AI BI tools?
What are the best AI BI tools?
Can AI analyse data without an analyst?
Can AI analyse data without an analyst?
Can I ask my data questions in plain English?
Can I ask my data questions in plain English?
What is the risk of using AI for data analysis?
What is the risk of using AI for data analysis?
What tool gets live data into spreadsheets?
What tool gets live data into spreadsheets?
Don't just pick a tool — get the whole workflow
Tell Comparee your goal and get a complete step-by-step AI workflow with the right tool for every step.